Hubble and Webb show how ultraviolet radiation, dust and young stars shape the Cat’s Head Nebula, about 7,500 light-years away.
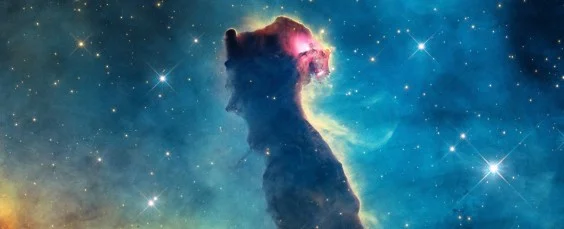
Three views of the Cat’s Head Nebula show how much an astronomical object can change when seen across different wavelengths. NASA’s Hubble and James Webb space telescopes have imaged this region of the Carina Nebula, about 7,500 light-years from Earth. Radiation and winds from massive stars have sculpted its gas and dust into a shape that resembles an upright cat, but that familiar outline is only one way to read the scene.
Each image brings different material into view because visible, near-infrared and mid-infrared light interact with the nebula in different ways. A feature that looks like a gap in one view might be filled with dust or glowing material in another. The images aren’t three versions of the same picture: together, they offer distinct clues about what’s present and how nearby stars are affecting it.
In Hubble’s visible-light image, bright yellow ridges trace gas energized by ultraviolet radiation. The blue, green and red regions show oxygen, hydrogen and sulfur, respectively. These colors help distinguish material in the processed image, though they don’t mean the nebula would look this way to a person standing nearby.
Astronomers think the gas may be undergoing photoevaporation: intense heating causes it to disperse. The idea connects the image’s bright edges to an ongoing physical process, as radiation from massive stars heats exposed gas while denser material can remain sheltered for longer. The glowing feature that reads as an eye may be a newly formed star, still obscured by dust in the pillar below it. That interpretation is tentative, but it gives the apparent face a possible connection to the region’s star-forming activity.
Dust comes into focus in infrared
Webb’s near-infrared image picks up starlight that dust partly hides from view, making the nebula’s cat-shaped body appear more transparent. More of the background emerges, while dense orange filaments remain visible. The difference is useful: dust can block some visible light, while near-infrared observations can reveal light from behind or within dusty regions.
That doesn’t mean the infrared image simply removes the dust from the scene. The filaments still mark places where material is concentrated, and the newly visible background gives those structures more context. Comparing the views offers a look at how material of different densities erodes at different rates under the influence of nearby stars. Similar regions often show a mix of exposed surfaces and protected pockets; here, the contrast makes that uneven process easier to see.
Mid-infrared shifts the focus to heat
Webb’s mid-infrared image shifts attention from starlight to heat. Dust and other carbon-based molecules show up in white outlines, giving this view a more spectral appearance. The result is less like a conventional portrait and more like a map of selected material in the nebula.
Read together, the images make the structure easier to interpret. Visible light highlights energized gas; near-infrared exposes starlight partly hidden by dust; mid-infrared traces warm dust and molecules. Each view leaves something out, so the value lies in comparing them. The nebula’s shape is a starting point, while the differences between images point to the materials and processes behind it.
What the three views reveal
The colors in the published images are assigned during processing; the telescopes record light measurements in grayscale. That distinction matters because color here is a way to translate data into a readable image, not a direct record of what a human eye would see. The chosen colors help viewers separate features, but interpretation still depends on what each instrument measured.
The cat-like outline is a useful visual hook, but the different views also reveal the forces shaping this part of Carina. Radiation and stellar winds can sculpt surrounding gas and dust, while dust can obscure stars and other structures from some wavelengths. This is more significant than it looks: the same region can tell different parts of its story depending on which light astronomers collect.
Why wavelength comparisons matter
For readers, the main lesson is that an astronomical image is also a tool for asking questions. Where does gas glow? Which structures remain hidden behind dust? What material is warm enough to stand out in mid-infrared observations? No single view answers all of those questions, and a striking resemblance to an animal can’t explain the physics on its own.
If you’re working in this space, the comparison is a reminder to treat visual interpretation as a first step, then check it against the wavelength and material being shown. Here’s the thing: the images are most informative when their differences are taken seriously. The apparent face draws the eye; the layered evidence beneath it is the point.
And yet, there’s a limit to what these images alone establish. The suggested star near the “eye” may be newly formed, and the gas may be dispersing through photoevaporation, but both are presented as interpretations rather than certainties. A vivid image can make a hypothesis feel settled. Not here.
Enjoying Nautilus? Subscribe to our free newsletter.
Lead image: NASA, ESA, CSA, STScI; Processing: Joseph DePasquale / STScI

Discussion
Sign in to join the discussion.